BlinkThorLabs
The Silent Killer: Stack Overflow in a System With No Stack Protector
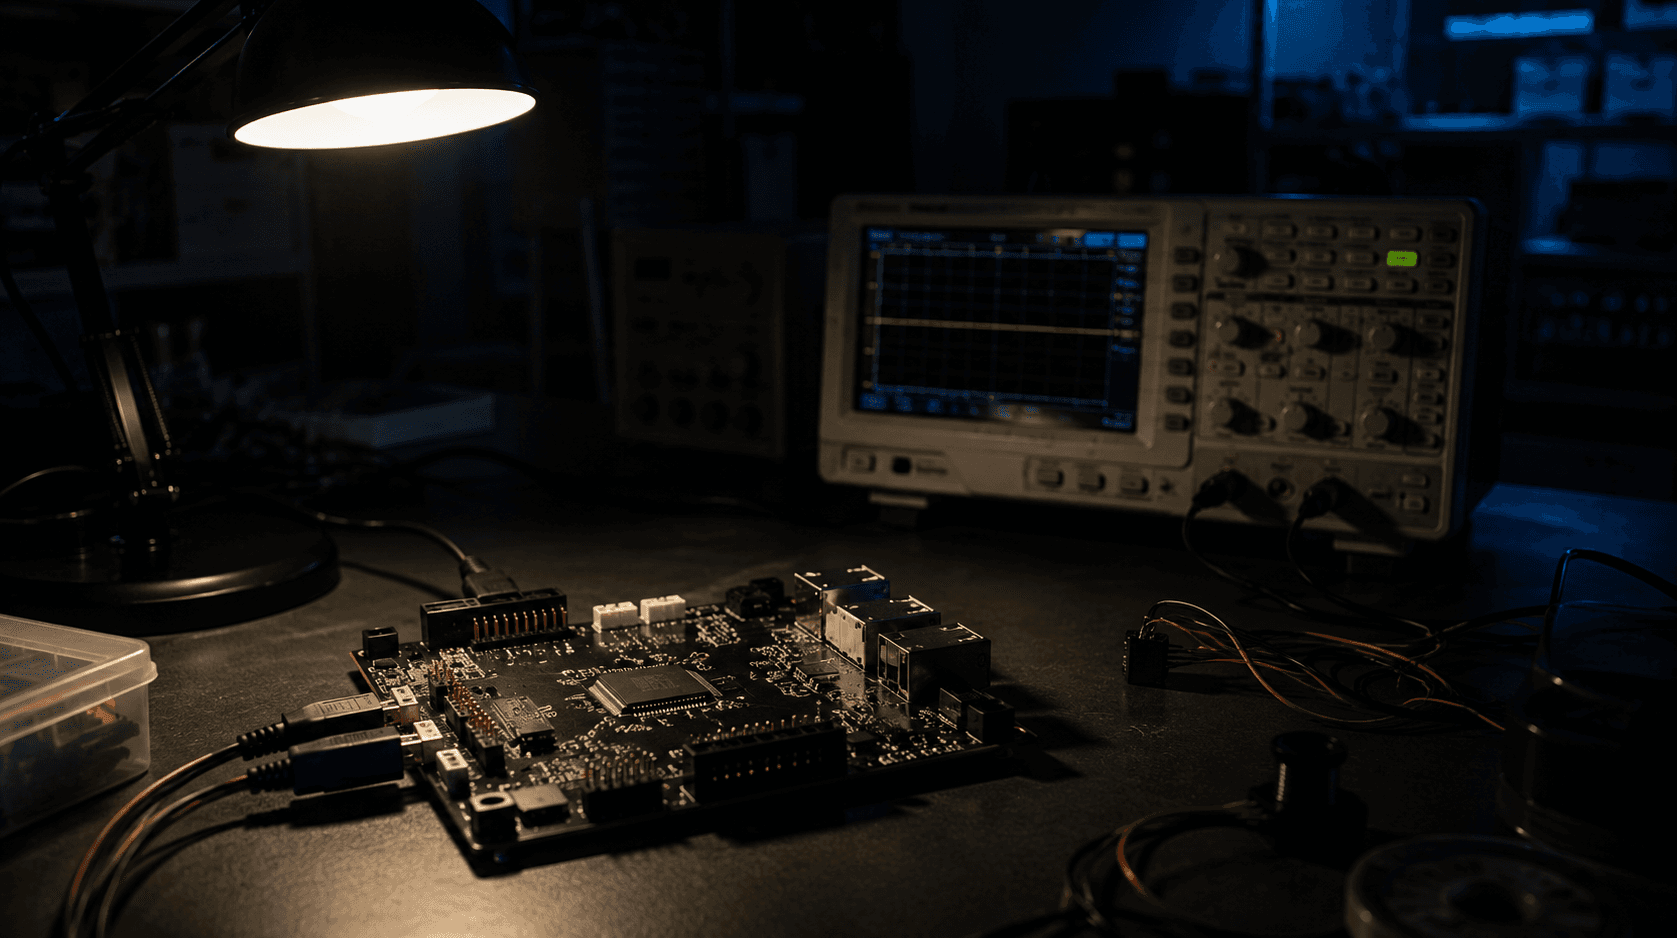
No log. No crash dump. No pattern. Just a system that stops existing, and a much longer list of suspects than the one that turned out to be guilty.
There are bugs that announce themselves, and there are bugs that just make everything stop. This is the story of one of the second kind — a hard fault with no witnesses, no evidence at the scene, and a suspect list that took us three weeks to narrow down to the one name we should have suspected from the beginning, if we'd known where to look.
The Scene of the Crime
The symptom, reported from the field, was as close to nothing as a symptom can be and still be a symptom: the device would run for anywhere from a few hours to several days, and then simply stop. No error output. No watchdog reset log, because there wasn't even a watchdog reset — this was a hard fault, the processor's own mechanism for saying "something happened here that I cannot continue past," and on this particular board, hard faults led to a full power-cycle-required lockup rather than any kind of graceful recovery or logged diagnostic.
No serial output at the moment of failure. No LED pattern. Nothing in the small amount of non-volatile logging the device did perform showed anything unusual in the seconds before the failure — the last logged events were completely mundane, routine operations that had succeeded thousands of times before without incident.
This is, for anyone who's debugged embedded systems for a while, one of the worst possible starting positions. We had a crime with no visible crime scene.
Suspect One: The Power Supply
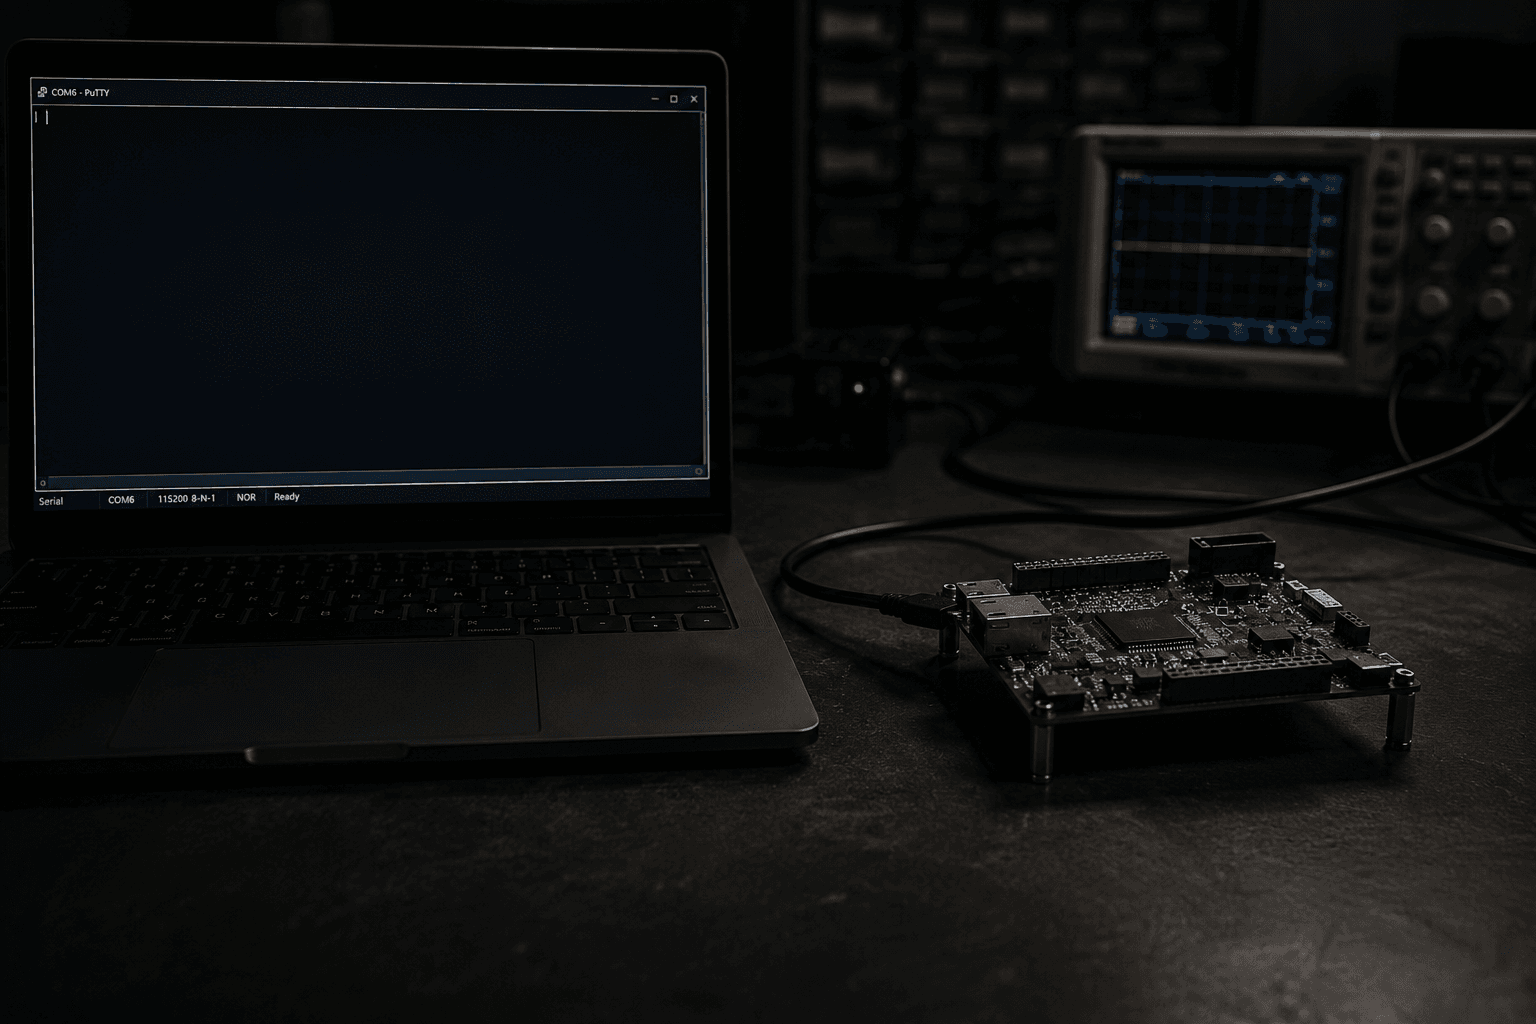
The first, most reasonable suspicion, always: something electrical. We pulled units from the field and scoped the supply rails under heavy load, specifically hunting for any transient dip that might explain a sudden processor fault. Clean. We checked brown-out detection configuration — properly enabled, properly configured, and not the source, since a brown-out event would have left its own distinct signature in the reset cause register, which showed nothing of the sort.
Suspect one, released without charge.
Suspect Two: A Specific Peripheral Driver
Next, we suspected a specific communication peripheral that had a slightly troubled history on a previous project — a driver that, in a different codebase entirely, had once been implicated in a timing-related lockup. We added targeted instrumentation around every call into that peripheral's driver, logging entry and exit with timestamps, hunting for any call that didn't return, any state that looked stuck.
Weeks of monitoring. The peripheral driver behaved exactly as documented, every single time, across multiple field-representative units. Suspect two, also released.
Suspect Three: A Race Condition We Genuinely Believed We'd Found
At around week two, we found something that looked, for a brief and hopeful moment, like the answer. A shared data structure, accessed both from a high-priority interrupt and from the main loop, without what we initially believed was adequate protection. This felt right — race conditions are exactly the kind of bug that produces symptomless, unpredictable failures with no consistent trigger.
We added proper locking. We deployed the fix to a test fleet. And the hard faults kept happening, at roughly the same rate, on units running the "fixed" firmware. This was the most demoralizing moment of the investigation — not because the fix was wrong to make (it was a legitimate, if unrelated, defensive improvement) but because it meant we had spent real time and real hope on a suspect who, it turned out, had a perfectly good alibi. The actual culprit was still out there.
The First Real Clue
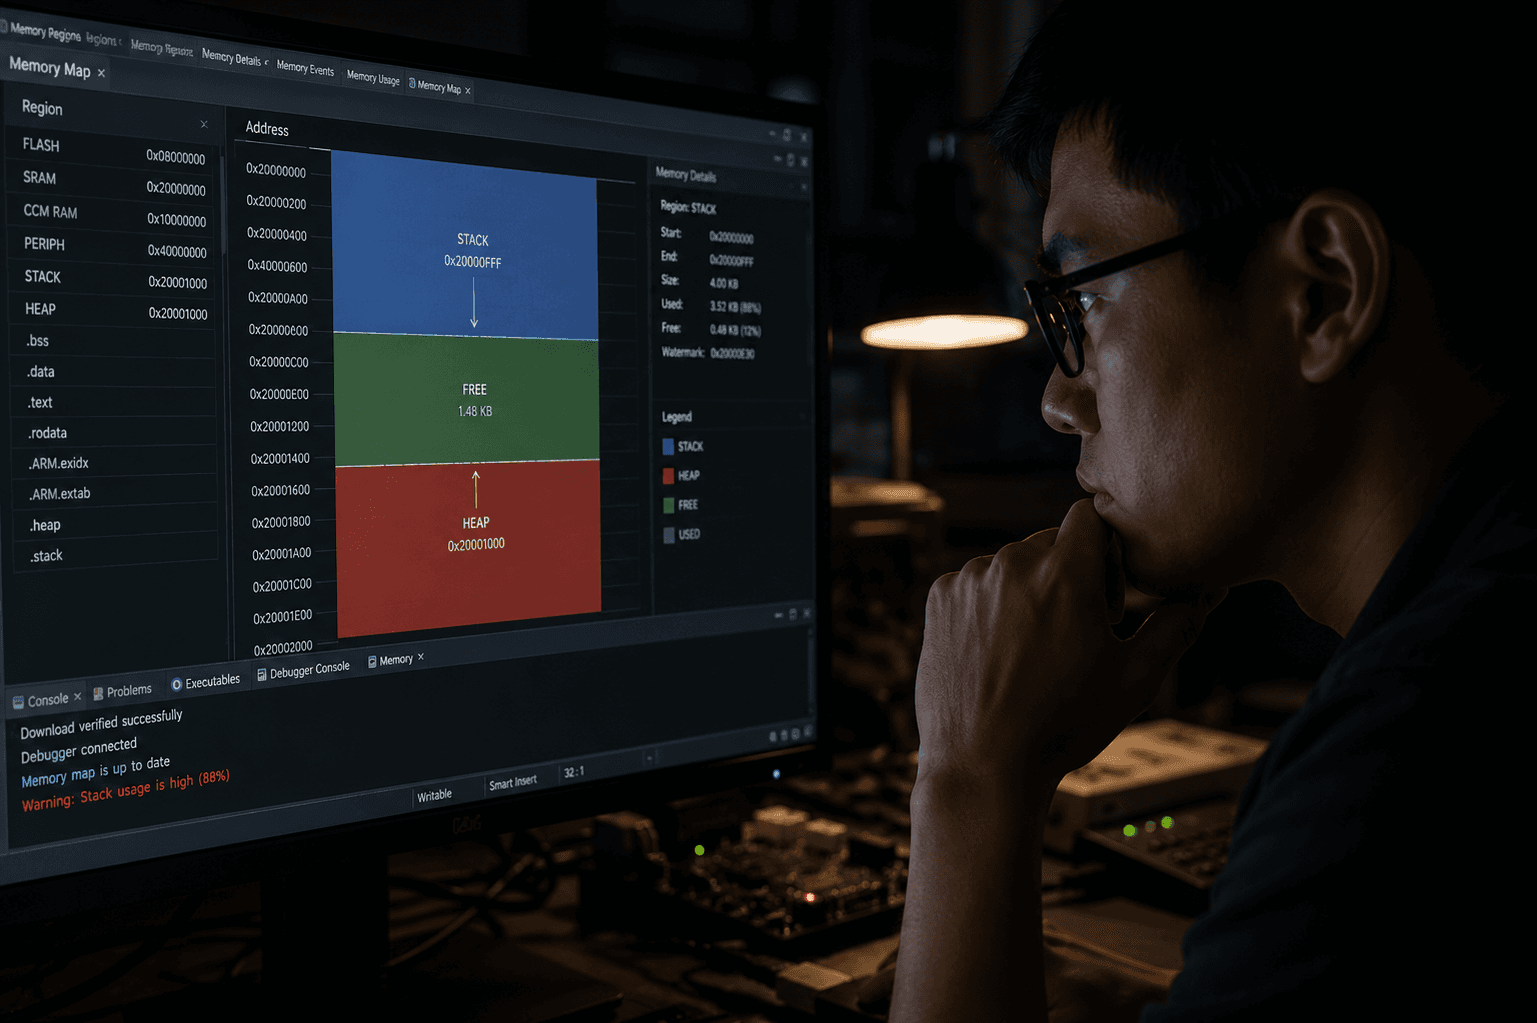
The break came almost by accident. An engineer, reviewing memory usage for an unrelated optimization task, happened to look at the linker map file's stack allocation and noticed something that hadn't been specifically checked before: the configured stack size for the task that eventually, always, turned out to be running at the moment of every field-reported fault (confirmed retroactively from the partial register state a few units preserved in a small battery-backed RAM region) was surprisingly modest — sized based on an estimate of the task's known call depth, from years ago, when the codebase was smaller.
This raised a quiet, uncomfortable question that nobody had asked yet: had anyone actually verified the current worst-case stack usage of that task, given everything that had been added to the codebase since that original sizing estimate was made? The honest answer was no. Nobody had, because nothing about a stack sizing estimate announces that it's become stale — it just quietly stops being accurate, and nothing in a normal test cycle necessarily exercises the specific path that would prove it wrong.
The Second Clue, and the Shape of the Suspect Finally Emerging
We pulled in a static stack usage analysis tool — something that had, embarrassingly, never been run against this specific codebase before, despite being standard practice we'd have insisted on for a new project. The analysis flagged one specific call path with a worst-case stack depth meaningfully higher than every other path in the same task, and traced that depth to a function inside a third-party library — a parsing routine, buried a few dependency layers deep, that the team had integrated years ago and had, in the intervening years, essentially stopped thinking about as "our code" at all.
The static analysis tool's report showed something specific and, once we saw it, immediately alarming: this parsing function was recursive, and its recursion depth was directly driven by the structure of its input data — deeper, more nested input structures caused deeper recursion, with no explicit depth limit anywhere in the library's implementation.
The Reveal
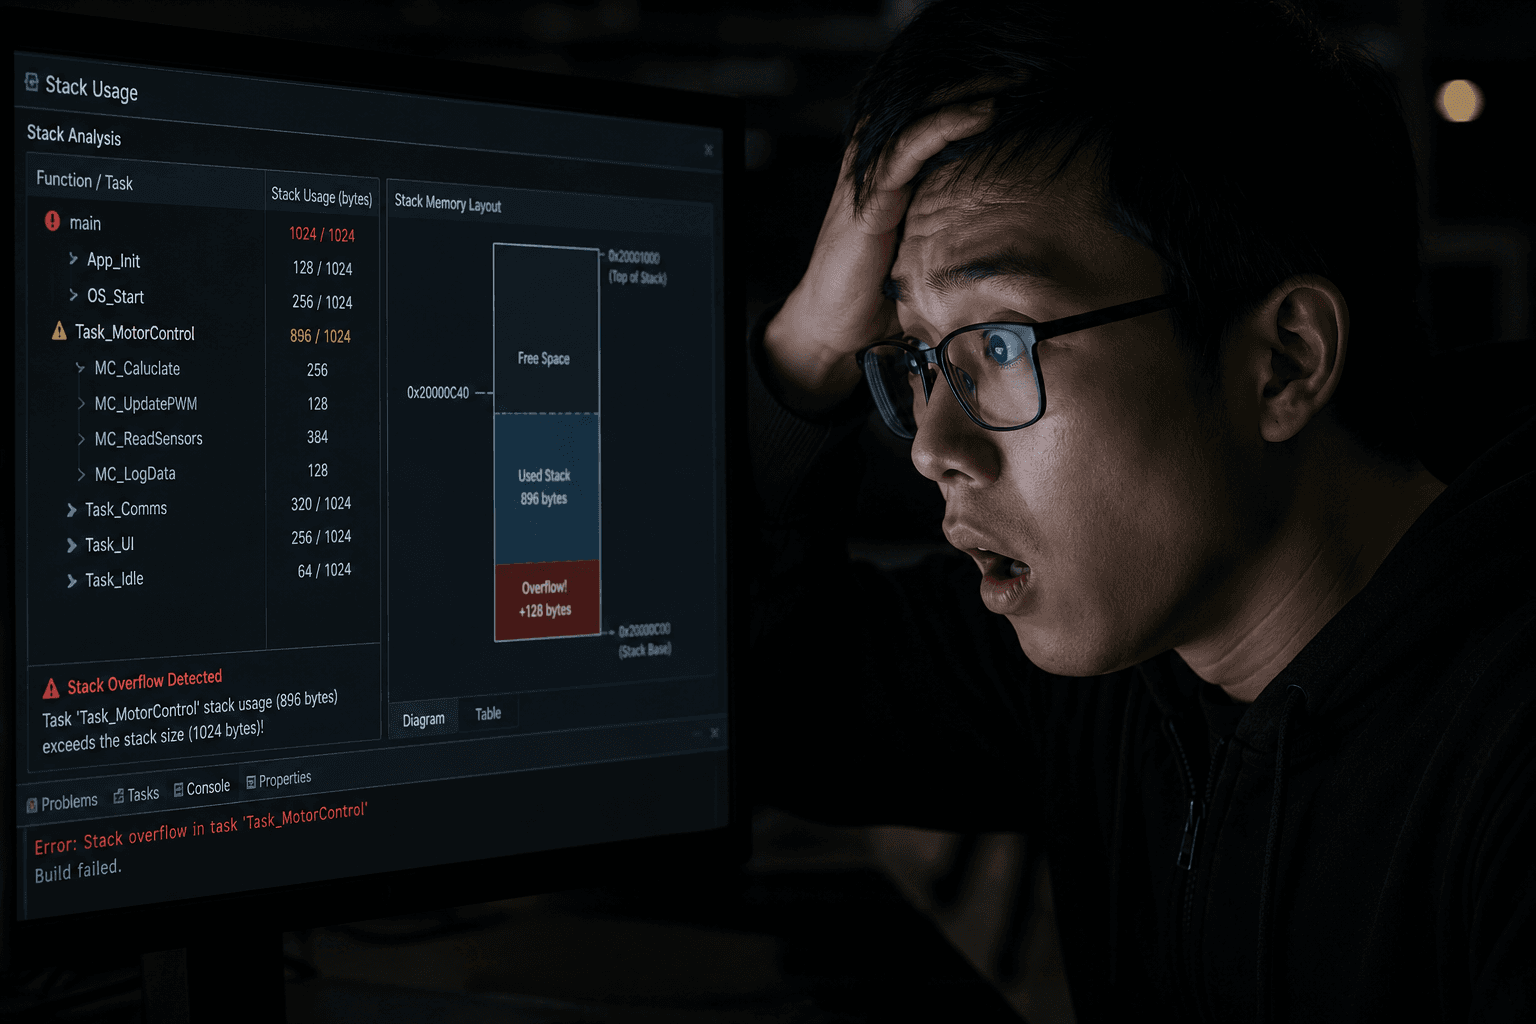
Here is what had been happening, every single time, for however many hours or days it took for the specific triggering condition to occur: the vast majority of input data the parsing routine ever encountered in normal operation had a shallow, simple structure — two or three levels of nesting, comfortably within the stack budget originally estimated for this task. But a rare, valid, correctly-formed input — one that occurred only under a specific and uncommon upstream condition, not corrupted or malicious, just unusually deeply structured — would drive the recursive parser dramatically deeper than typical, consuming far more stack space per recursive call than the shallow, common case ever did.
When that rare input occurred, the recursive parsing calls consumed stack space beyond what had been allocated for the task, silently overwriting adjacent memory — and because this board's specific MCU/toolchain configuration had no stack protector, no guard page, no MPU-based stack overflow detection enabled, there was no mechanism to catch this corruption at the moment it happened. The system continued running on corrupted memory for an unpredictable, variable amount of time afterward — sometimes failing almost immediately, sometimes limping along for a while longer before whatever got corrupted finally caused something the processor genuinely could not recover from, manifesting as a hard fault with no discernible connection, by the time it actually occurred, back to the original moment of overflow.
This is precisely why the bug had no consistent symptom, no reproducible trigger anyone could pin down for two weeks, and no evidence at the scene — the actual root cause and the visible failure were separated by an unpredictable amount of time and an unpredictable amount of unrelated code execution in between, laundering all the evidence of what had actually gone wrong before the failure ever became visible.
The Fix
Three changes, none of them individually exotic, but the combination is what actually closes this class of bug rather than just patching this one instance of it.
We ran static stack usage analysis as a standing, mandatory CI check going forward, not a one-time investigation tool — every task's worst-case stack depth, recalculated automatically on every build, flagged if it approaches a defined safety margin against its allocated stack size. This is what should have caught the original sizing estimate going stale years before it actually mattered.
We enabled hardware-based stack overflow detection — an MPU-configured guard region immediately beyond each task's allocated stack, which had been available on this MCU the entire time and simply hadn't been configured. This doesn't prevent an overflow from happening, but it converts a silent, delayed-action memory corruption into an immediate, unambiguous fault at the exact moment and exact call site where the overflow occurs — turning a three-week forensic investigation into something that would now be a five-minute stack trace read.
We imposed an explicit maximum recursion depth inside the third-party parsing routine, patched directly into our vendored copy of the library, with a defined, safe failure path (reject the malformed-for-our-purposes input, log the rejection) if a genuinely rare, deeply-nested input ever exceeds it — converting an unbounded, input-driven stack consumption into a bounded, analyzable one.
The Lesson
The uncomfortable truth in this investigation is that the actual bug was never hiding particularly well. It was sitting in a static stack analysis report that simply hadn't been run, in a recursion depth that simply hadn't been bounded, in a hardware protection feature that simply hadn't been enabled — three separate, ordinary omissions, each individually unremarkable, that together produced a bug capable of consuming three weeks of investigation and pointing suspicion at three entirely innocent parties before the real cause was found.
If your embedded system doesn't have static stack usage analysis running in CI, and doesn't have hardware stack overflow detection enabled, you don't currently know whether you have this bug. You only know whether it's happened to you yet.