BlinkThorLabs
Debugging a Watchdog Reset That Only Happens in Production
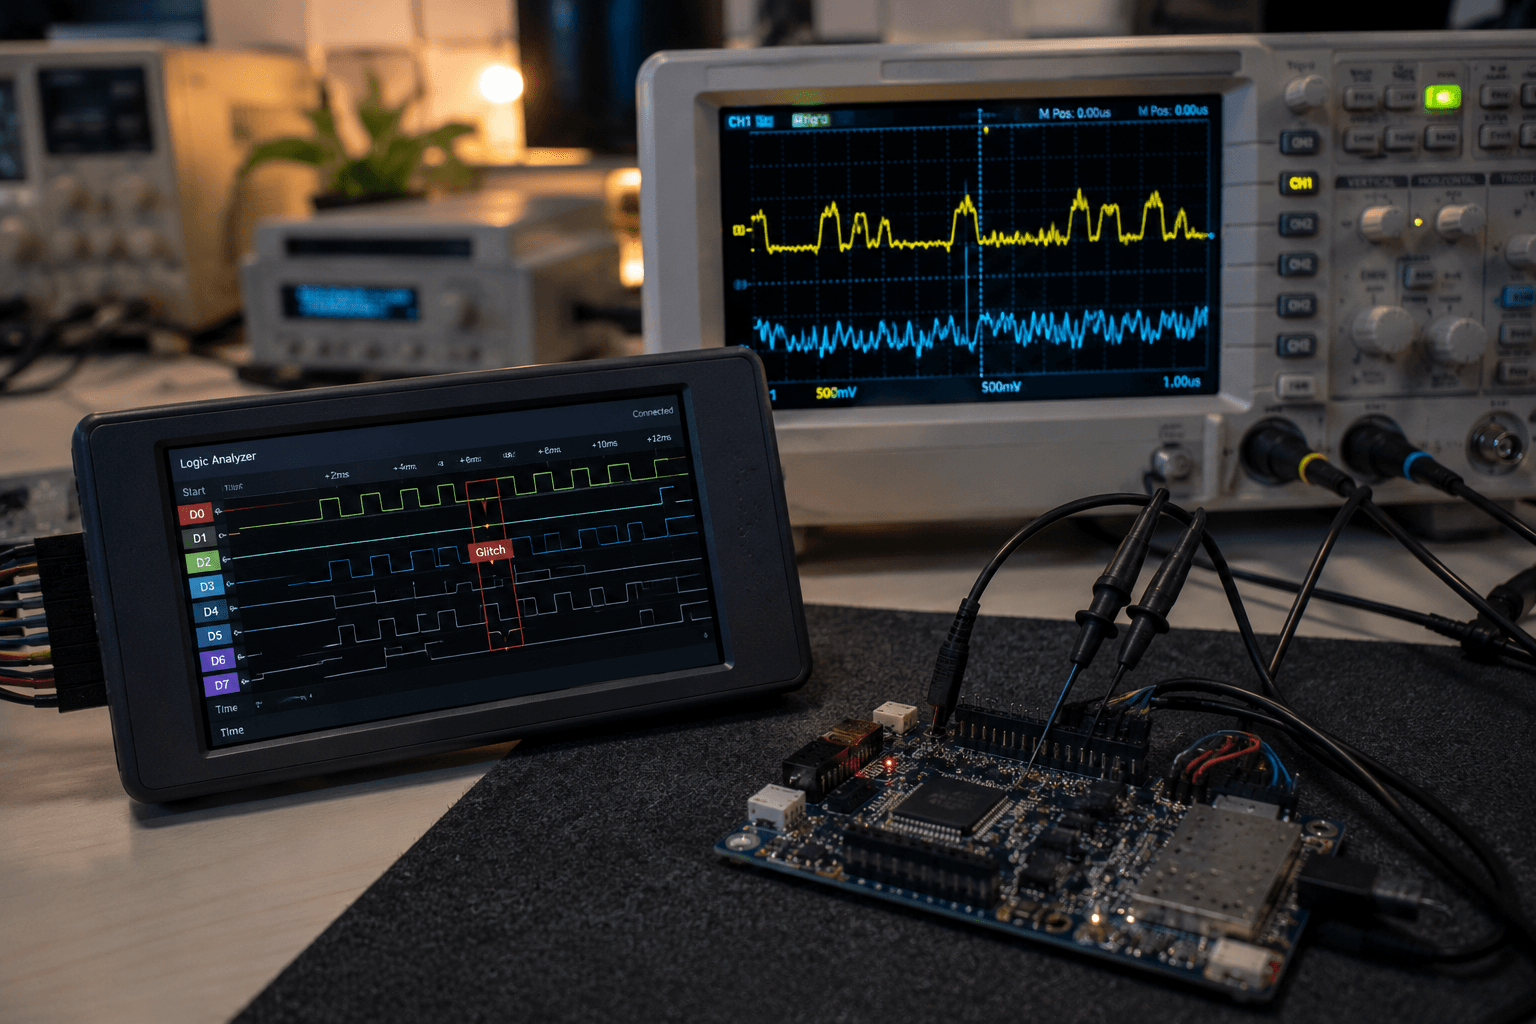
A three-week hunt through a race condition between an ISR and a flash write routine.
Three weeks. That's how long it took us to find a bug that reproduced maybe once every four to seven days, only in the field, and never — not once — on the bench.
If you've done embedded firmware long enough, you already know this story has a familiar shape. What made this one worth writing down is the specific mechanism: a flash write routine and an interrupt service routine (ISR) fighting over the same few microseconds, and a watchdog that had absolutely no patience for either of them.
The Symptom
The report from the field was frustratingly vague: units were rebooting themselves after running for anywhere between four days and three weeks. No pattern in time of day. No pattern in ambient temperature logs. No correlation with a specific batch, a specific firmware version, or a specific customer site. The only consistent fact was a line in the boot log:
[BOOT] Reset source: WATCHDOG
[BOOT] Last known state: RUNNING
That's it. No crash dump, no stack trace, no assert. Just "I was running fine, and then I wasn't."
On the bench, we could not make it happen. We ran units continuously for two weeks under simulated load, cycling through every feature path we could script, and every single one came back clean. This is the point where a lot of debugging sessions quietly die — the bug becomes "a field issue," gets a low-priority ticket, and everyone moves on. We didn't have that luxury; the reset was starting to affect a customer's uptime SLA.
Ruling Out the Usual Suspects
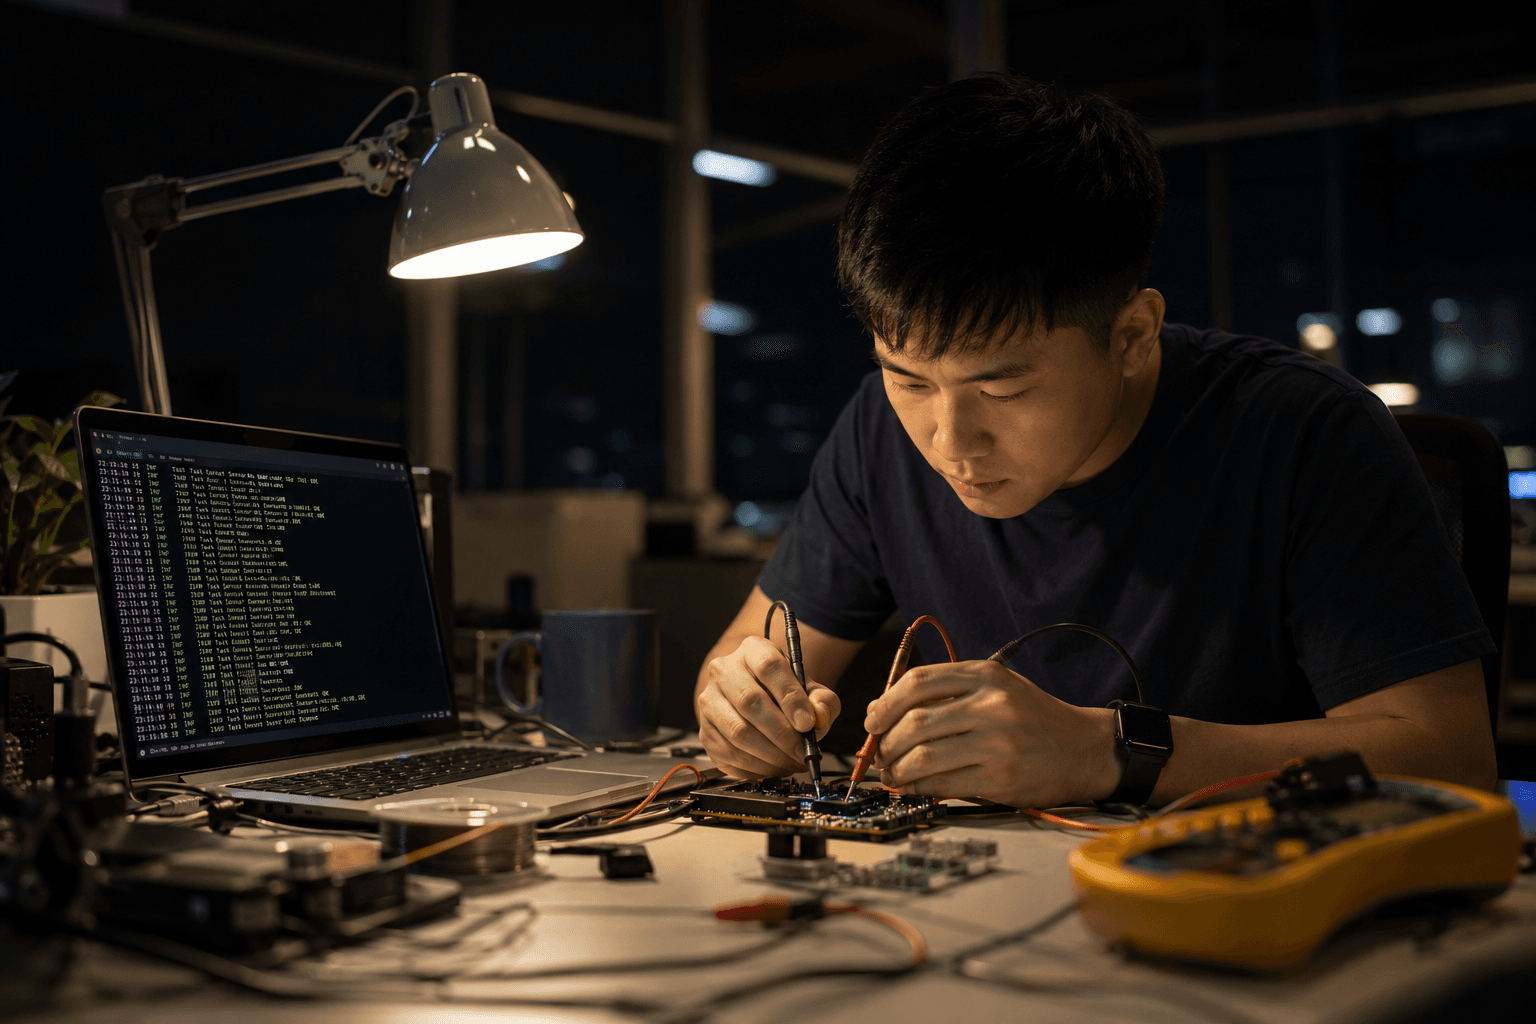
Before touching a single line of code, we went through the standard hardware checklist, because a watchdog reset is the most generic symptom in embedded systems — it's the "something is wrong" light, not a diagnosis.
Power supply and brown-out. We pulled units from the field with the failure history and checked the brown-out detector (BOD) flag on boot. Clean. We also scoped the 3.3V rail on a returned unit under worst-case load (radio TX burst + flash write + peripheral wake simultaneously) and saw ripple well within spec — no dips anywhere close to the BOD threshold.
Temperature. Field units were deployed in enclosures ranging from air-conditioned server rooms to outdoor cabinets. If this were thermal, we'd expect a correlation with the hottest deployments. We didn't see one. Units in climate-controlled rooms failed at roughly the same rate as units in outdoor cabinets.
EMI / external interrupts. We checked whether the failure rate correlated with proximity to motors, relays, or other noisy equipment on site. No pattern.
At this point, three things were true: the hardware was clean, the failure was real, and it wasn't happening on the bench. That combination almost always means one thing — the bug depends on a timing condition that only shows up under real-world load patterns, not synthetic test load. Which meant it was time to stop looking at the board and start looking at scheduling.
Catching It With a Logic Analyzer and a Trace Buffer
Since we couldn't reproduce the failure on demand, we couldn't just single-step through it. We needed to capture the failure the moment it happened and preserve enough context to reconstruct what led up to it.
We did two things in parallel:
- Instrumented trace buffer. We added a small ring buffer in RAM (untouched by the watchdog reset, since our reset only power-cycled the core, not RAM contents on this SoC) that logged a timestamp + event ID on every ISR entry/exit and every flash operation start/end. On boot, if the reset source was
WATCHDOG, we dumped the last ~500 entries over UART before anything else ran. - Long-duration logic analyzer capture. On one bench unit, we hooked a logic analyzer to the flash write-enable pin, the relevant GPIO interrupt line, and the watchdog kick signal, and let it run continuously with a large capture buffer, waiting for a failure.
It took eleven days on the bench with the analyzer running before we caught one. But when we did, the trace buffer dump told the whole story:
t=0            [ISR_ENTER]  GPIO_EXTI  (external sensor interrupt)
t=+12us        [FLASH_WRITE_START] sector=0x0801FC00
t=+38us        [ISR_ENTER]  GPIO_EXTI  (re-entrant, same line)
t=+39us        <trace buffer ends — no further entries before reset>
The flash write had started, and 38 microseconds into it, the same external interrupt fired again — and something about that overlap caused the system to lock up long enough to blow through the watchdog timeout window.
Why This Actually Breaks Things
Here's the mechanism, and it's a classic one once you see it.
On our MCU, writing to internal flash isn't like writing to RAM — the flash controller needs the CPU to execute the write sequence (unlock, program, wait-for-completion) largely undisturbed, and depending on the flash architecture, the CPU cannot fetch instructions from the same flash bank while a write is in progress. Some parts handle this transparently with a wait-state stall; ours did not fully hide this from code executing out of the same bank.
Normally this isn't a problem because our flash write routine was short (under 20us typically) and interrupts were usually quiet during that window. But under the exact field conditions — a sensor generating interrupts at a higher rate than our bench test simulated — an ISR could fire during the flash program cycle. When that happened:
- The ISR vector fetch and the ISR body itself needed to execute from flash.
- The flash controller was mid-operation and stalled that fetch.
- Our watchdog kick, which lived inside the main loop and was scheduled to occur every 8ms, was itself dependent on the main loop resuming promptly after the ISR returned.
- If a second interrupt arrived while the first ISR was still stalled waiting on the flash controller — which is exactly what the trace showed — the stall compounded, and total blocked time exceeded our 16ms watchdog timeout.
None of this showed up on the bench because our bench test harness generated the triggering sensor interrupt at a lower, more "well-behaved" rate than real field sensors, which occasionally burst at 2-3x the rate we'd tested. Flash writes happened constantly (we wrote telemetry to flash roughly every 90 seconds), so it was really a matter of statistics: the window where a burst of interrupts overlapped a flash write was small, but not small enough to stay at zero over weeks of continuous field operation.
The Fix
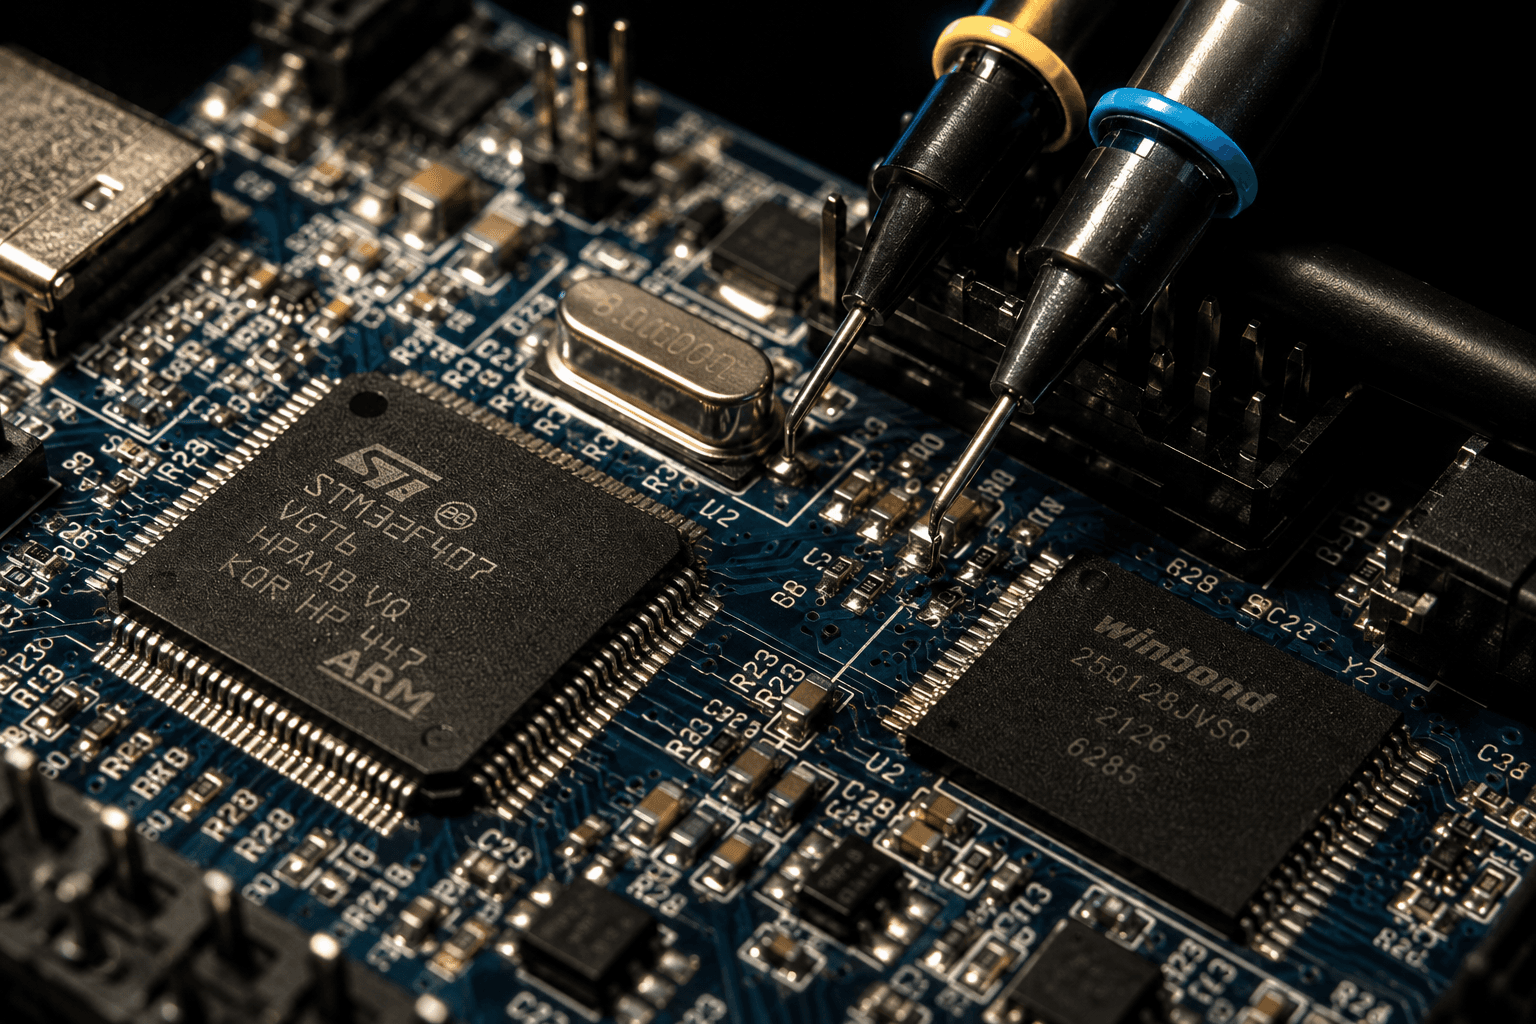
The fix itself is a few lines, which is almost always true once you've correctly diagnosed a race condition — the hard part is never the patch, it's the three weeks before the patch.
We wrapped the flash write routine in a critical section that disabled the specific interrupt line responsible (not a blanket __disable_irq(), since other interrupts — including a safety-relevant one — needed to keep running):
void flash_write_sector(uint32_t addr, const uint8_t *data, size_t len) {
    NVIC_DisableIRQ(SENSOR_EXTI_IRQn);

    flash_unlock();
    flash_program_sequence(addr, data, len);
    flash_wait_complete();
    flash_lock();

    NVIC_EnableIRQ(SENSOR_EXTI_IRQn);
}
We also added a hard upper bound: if flash_wait_complete() didn't return within a defined budget (2x worst-case measured duration), we now explicitly kick the watchdog once mid-wait and log an event, rather than silently trusting that the write would finish before the next scheduled kick. This turns a silent multi-week failure into, at worst, a logged anomaly with no reset at all.
We deployed this to a canary group of field units and let it run for four weeks — longer than the worst historical failure interval we'd seen — with zero resets. It's now been in the field for several months without a single recurrence.
The Lesson
A few things we took away from this, worth repeating to anyone doing embedded firmware on flash-based MCUs:
Bench tests reproduce the load you thought to simulate, not the load that actually exists. Our sensor interrupt rate assumption came from a spec sheet, not from real deployed hardware behavior. The gap between "typical" and "worst observed" is exactly where these bugs live.
Any operation that can stall instruction fetch — flash writes, EEPROM emulation, some low-power mode transitions — needs to be treated as a critical section with respect to interrupts, not just with respect to other tasks. It's easy to reason about race conditions between two pieces of application code and forget that the hardware itself can introduce a stall that behaves exactly like a race condition from the CPU's perspective.
Watchdog kicks should never depend on an interrupt or operation finishing "usually in time." If a kick is scheduled from the main loop, and something can legitimately delay the main loop by more than your timeout — even rarely — you need either a hardware-level guarantee that it won't, or an explicit kick placed on the far side of the risky operation.
When you can't reproduce a bug on the bench, don't wait for reproduction — build the instrumentation that will catch it the one time it happens, and let it run. The trace buffer that survived the reset was the single most valuable piece of code we wrote in this whole investigation. Everything else was confirmation.
Three weeks is a long time to spend on four lines of code. But the four lines weren't the point — understanding exactly why a sensor firing at the wrong microsecond could take down a device that had otherwise been rock solid for a decade of deployments, that was the point.
If your team is debugging something similar — a race condition that only shows up in production, or a watchdog that resets with no clear cause — we'd be glad to compare notes.