BlinkThorLabs
Reading a Radar Datasheet Like an Engineer, Not a Salesperson
Every number on that page is true. Not all of them are true in the way you're about to assume.
A radar datasheet is not lying to you, and it's worth starting there, because the healthy version of skepticism this article is arguing for isn't "distrust the manufacturer." Every number on a well-made datasheet was measured under some real, specific, disclosed test condition, and it's genuinely accurate under that condition. The problem is almost never the number itself — it's the gap between the condition the number was measured under and the condition your system will actually operate in, a gap that datasheets are structurally prone to leaving implicit rather than stated loudly on the front page.
Here are the three numbers we've personally been surprised by, what actually caused the surprise, and how we've learned to verify each one ourselves rather than design against the headline figure.
"Maximum Range: 250m"
What it usually means, precisely: the range at which a target of a specific, disclosed radar cross-section (RCS) — commonly a large flat metal reflector, sometimes specified as equivalent to a standard passenger car viewed from the rear, sometimes not clearly specified at all — is detectable at a stated probability of detection and false-alarm rate, under otherwise ideal conditions: no clutter, no interference from other radar units, no adverse weather, and often a single, isolated target with nothing else in the scene competing for the same range-Doppler bins.
Where this surprised us: we spec'd an early integration around a 250m headline range figure for a highway lead-vehicle detection use case, and got noticeably shorter reliable detection distances in early field testing against smaller sedans and, especially, motorcycles — both of which present meaningfully lower RCS than the reference target the datasheet's range figure was almost certainly based on. The datasheet wasn't wrong. We had unconsciously read "250m range" as "250m range for the things I need to detect," when it was actually "250m range for a specific, larger reflector than most of the things we needed to detect."
How to verify it yourself: ask the vendor directly what RCS value the stated range figure assumes — a legitimate datasheet should be able to answer this, even if it's not printed prominently. Then, separately, get or estimate RCS figures for your actual target classes (passenger cars, motorcycles, pedestrians) at your operating frequency band, and recompute expected range using the radar equation's RCS scaling relationship, which is a fourth-root relationship — meaning a target with a quarter of the reference RCS doesn't detect at a quarter of the range, it detects at roughly 70% of the range, which is a smaller effect than intuition suggests but still very much worth accounting for explicitly rather than assuming the headline number transfers directly to your actual target mix.
"Angular Resolution: 1.5°"
What it usually means, precisely: the minimum angular separation at which the radar can resolve two targets as distinct returns, typically measured with two similar-RCS targets at the same range, in a clean, low-clutter test environment, and — this is the part that's easy to miss — often measured with exactly two targets present, not with the kind of multi-target, multi-return scene an automotive radar actually has to disentangle in a real urban environment.
Where this surprised us: a multi-lane highway merge scenario, several vehicles at closely spaced angles and similar ranges, produced noticeably worse angular discrimination in practice than the headline resolution figure implied — two adjacent vehicles that should have resolved as distinct targets based on the stated 1.5° figure were, in a meaningful fraction of test frames, merged into a single detected return or exhibited unstable, flickering separation frame to frame. The datasheet's resolution figure was measured correctly, for the scenario it was measured under — a clean two-target case. Real multi-target scenes introduce additional angular ambiguity from sidelobe interactions and overlapping range-Doppler responses that a simple two-target resolution test doesn't exercise, and that degradation isn't visible anywhere in a single resolution specification.
How to verify it yourself: don't rely on the headline resolution number for any scenario involving more than two closely-spaced targets — request or independently test angular discrimination specifically in a representative multi-target density scenario matching your actual operating environment (urban intersection density, highway merge density), not the vendor's clean two-target test setup. If the vendor can provide a detection probability curve as a function of angular separation under realistic clutter density, that's a meaningfully more useful figure for system design than the single clean-condition resolution number, and it's worth explicitly asking for it even if it's not part of the standard datasheet package.
"Field of View: ±60°"
What it usually means, precisely: the angular range over which the radar can nominally detect targets at all — but critically, this figure describes detection existence, not detection quality, across that range. Antenna gain, and consequently effective detection range and angular accuracy, both degrade toward the edges of the stated FOV, often substantially, because antenna patterns are not flat-top rectangles — they roll off toward the specified boundary, and the boundary itself is frequently defined by a somewhat arbitrary threshold (a common convention is the point where gain drops 3dB from boresight) rather than the point where performance actually becomes unreliable for your use case.
Where this surprised us: a cross-traffic detection scenario near the edge of the specified FOV — vehicles approaching from a perpendicular side street, close to the ±60° boundary — showed meaningfully reduced detection range and noisier angular estimates compared to targets at similar range near boresight. Nothing here contradicts the datasheet; ±60° accurately describes where the radar can detect something. It says considerably less about how confidently it can detect the thing you specifically need to detect, at the range you need to detect it, near that same boundary.
How to verify it yourself: request the actual antenna gain pattern (or, if you can get it, a detection range curve as a function of azimuth angle) rather than relying on a single FOV number — a real gain-versus-angle plot will show you exactly how much range and accuracy degradation to expect as you move off boresight, which is the information actually needed to decide whether a given use case is viable near the edge of the stated FOV, rather than just assuming uniform performance across the entire specified angular range because the datasheet quotes one number for the whole span.
The General Pattern Worth Internalizing
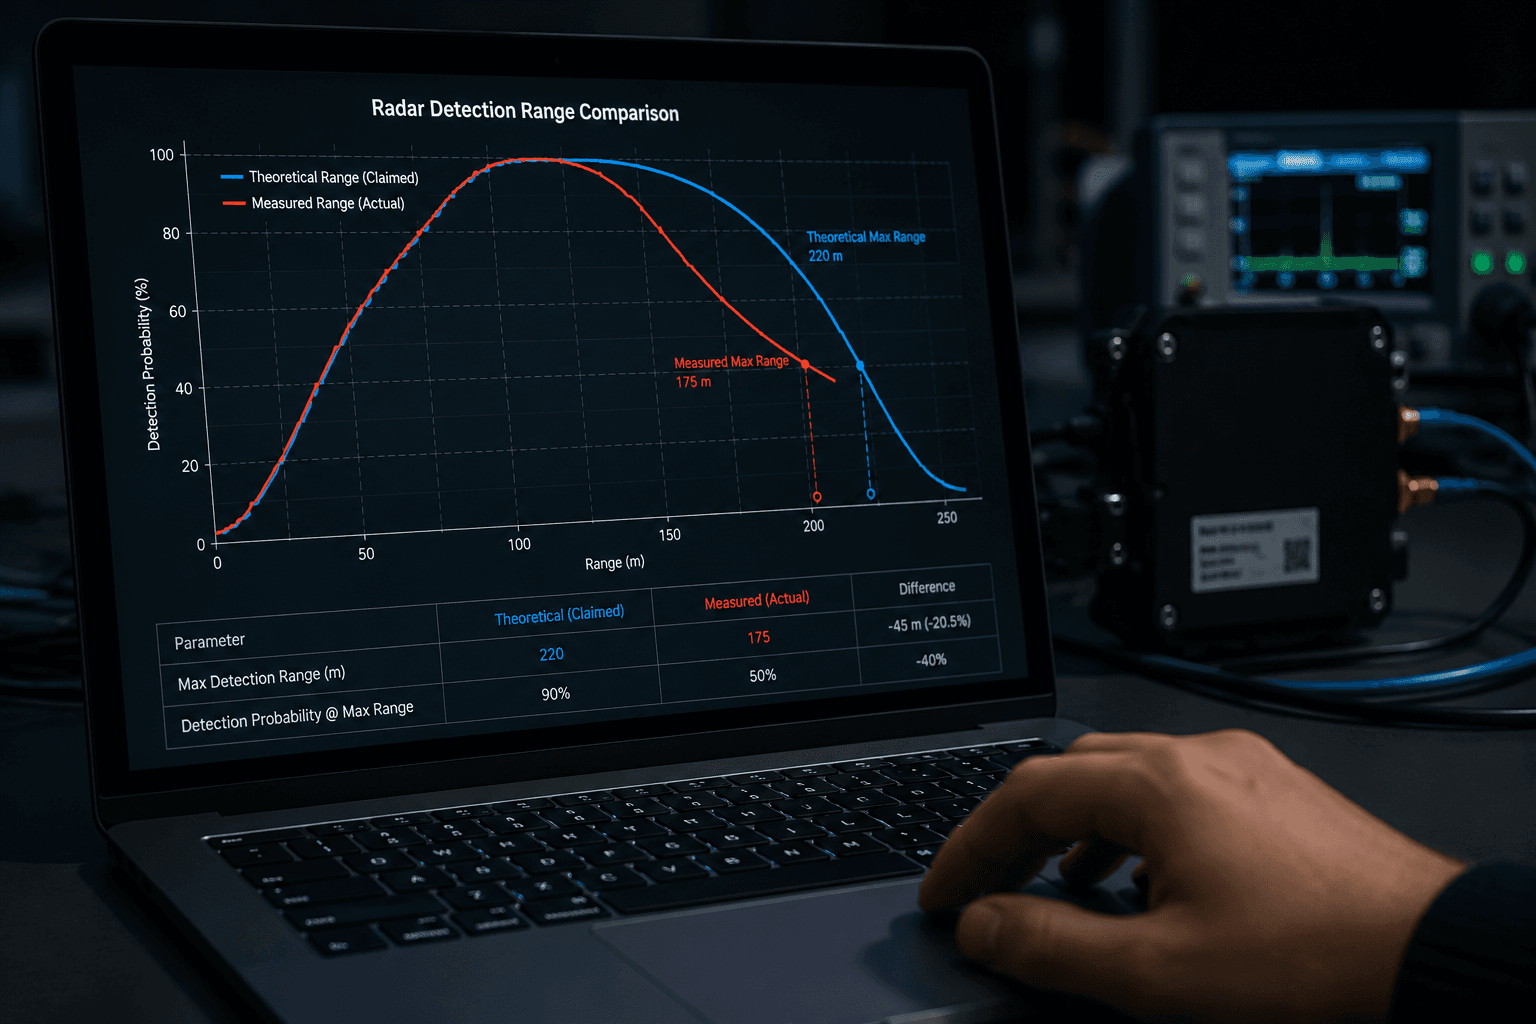
Notice that all three of these aren't cases of a manufacturer publishing a false number — they're cases of a single summary statistic being asked to represent a multi-dimensional performance surface (range vs. RCS, resolution vs. target density, gain vs. angle), and the summary statistic being technically correct at exactly the one point on that surface it was measured at. This is not unique to radar, or to automotive sensors, or even to hardware generally — it's a structural property of any spec sheet that reduces a curve to a headline number. The skill worth building isn't "don't trust datasheets." It's asking, for every headline figure, "under what specific condition was this measured, and how far is my actual operating condition from that one?" — and then, wherever that gap looks meaningful for your specific use case, going and measuring it yourself rather than assuming linear or negligible degradation between the tested condition and your real one.
None of this is a criticism of any specific vendor's documentation practices — every radar datasheet we've read follows this same general pattern, because it's an inherent property of how spec sheets are built industry-wide, not a shortcut any particular manufacturer is taking. The fix isn't better datasheets. It's engineers who read every headline number as the start of a question, not the end of one.