BlinkThorLabs
What 10,000 Hours of Fleet Logs Taught Us About Edge Cases
The scale, the method, and the top five failure patterns nobody put in the original training set.
The Scale
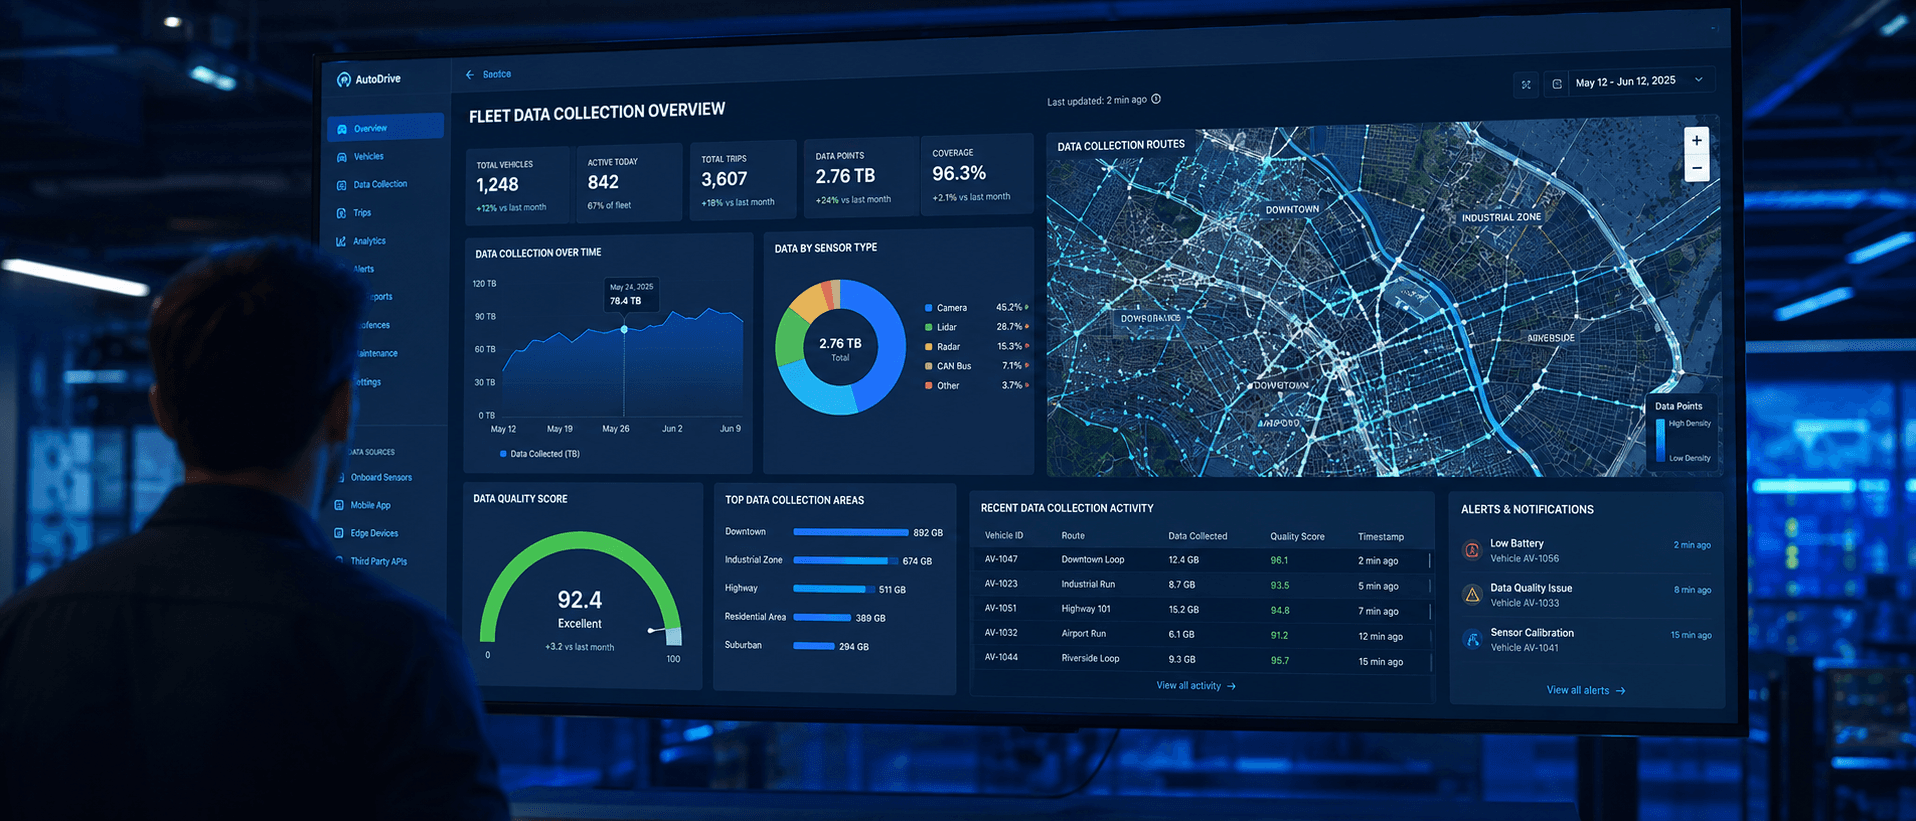
Over the past year, our test fleet accumulated just over 10,000 hours of driving logs — a mix of highway, urban, and mixed-condition routes, across roughly 40 vehicles, spanning four seasons and a genuinely wide range of lighting and weather conditions. That's a large enough dataset that manually reviewing it end to end was never realistic; even at a generous review rate of one hour of footage per fifteen minutes of engineer time, full manual review would have consumed more engineer-hours than we had allocated to the entire program. The real question this project set out to answer wasn't "what's in this data" — it was "how do we find the interesting 0.1% without reading the other 99.9%."
The Method
Our edge-case mining pipeline runs on two independent signals, and the interesting cases are the ones where either signal fires strongly, or — more valuably — where both fire in a correlated way across the same window of driving.
Model uncertainty spikes. Our perception model outputs calibrated confidence scores per detection, and we flag any frame where confidence for an otherwise-tracked object drops sharply without a corresponding sharp change in the object's actual physical behavior — a signature that typically means the model is seeing something genuinely ambiguous, not that the underlying scene changed.
Cross-sensor disagreement. Where camera-based detection and radar/LiDAR-based detection significantly diverge on the same physical region — one modality reporting an object with meaningful confidence while another reports nothing, or the two disagreeing substantially on range or classification — we flag the window for review. This signal is specifically valuable because it surfaces cases where one sensor is being fooled by something the other modality isn't sensitive to, which is a fundamentally different (and often more informative) failure signature than a single model just being generically uncertain.
Across the full 10,000-hour dataset, this combined flagging approach surfaced approximately 0.34% of total drive time — about 34 hours — as warranting engineer review, a roughly 300x reduction in review burden compared to full manual review, while, based on spot-checking a random sample of unflagged footage, missing what we estimate to be a low single-digit percentage of genuinely interesting cases. That trade-off — catching the large majority of interesting edge cases while reviewing a small fraction of a percent of total footage — is what makes this kind of pipeline actually operable at fleet scale rather than a nice idea that only works on a small pilot dataset.
The Top Five, Ranked by How Much They Surprised Us

1. Tree shadow patterns mimicking static obstacles — 22% of all flagged uncertainty spikes.
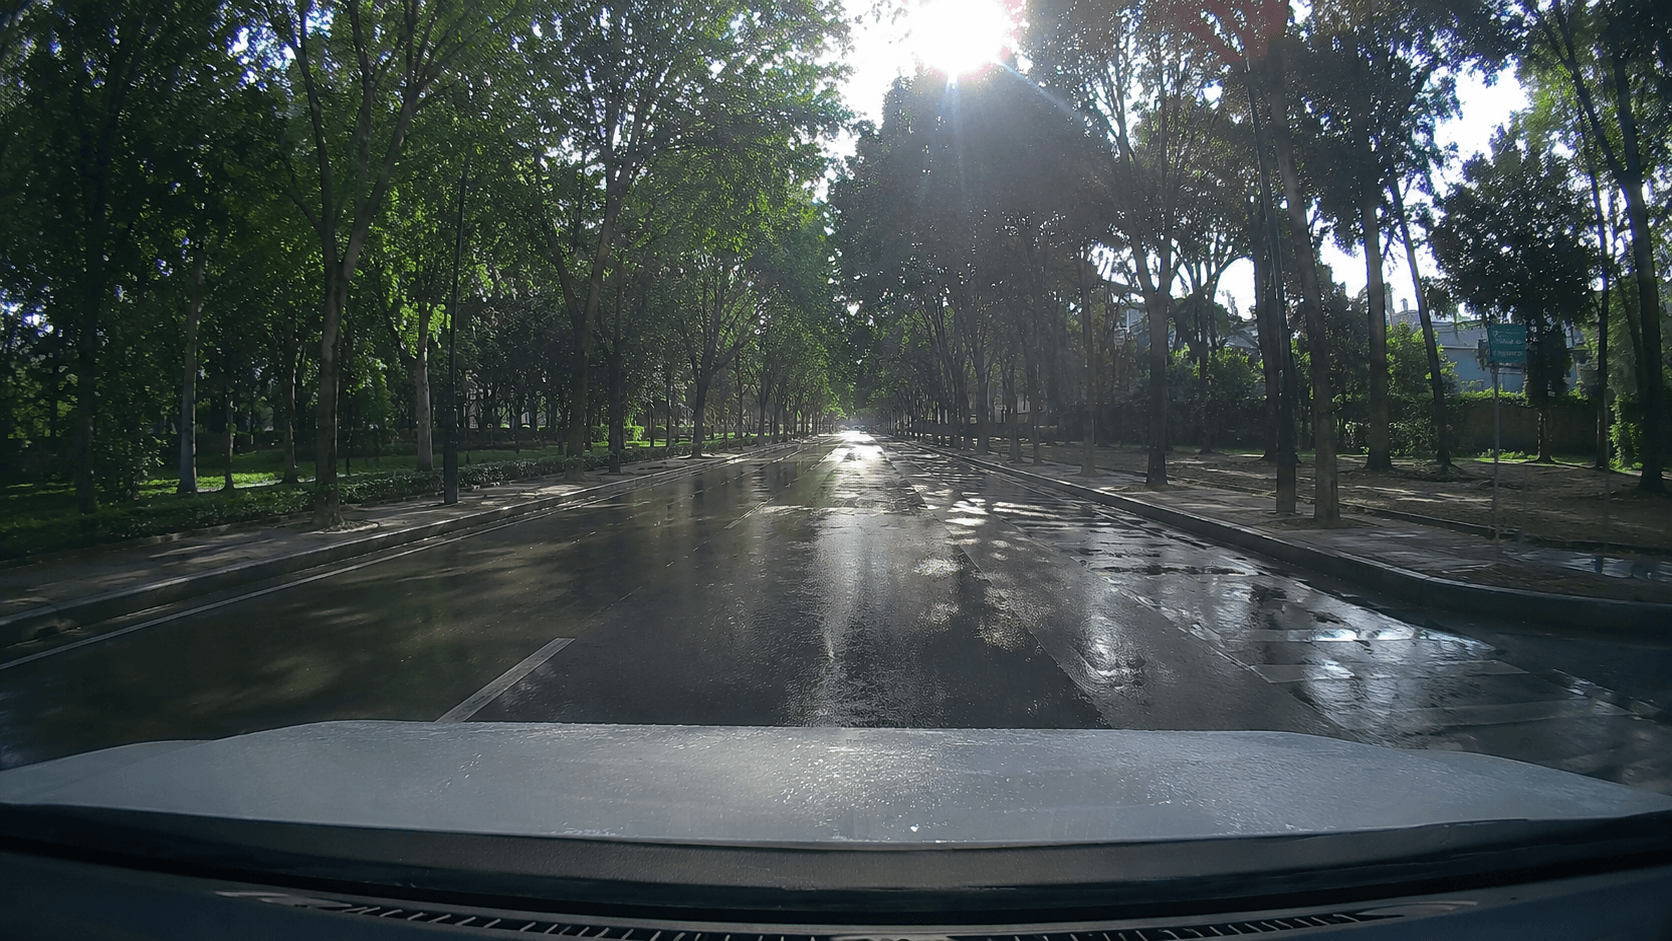
By far the largest single category, and initially the most confusing to diagnose. On sunny days with strong directional light, dappled shadow patterns cast by roadside trees onto the road surface — particularly moving shadow edges as the vehicle drove past — produced camera-based detections with moderate confidence for small, static-object-shaped obstacles that didn't exist. Cross-referencing against LiDAR data (which correctly showed nothing there) is precisely how the cross-sensor disagreement signal caught this category so reliably — the camera model, trained predominantly on data where shadow patterns correlated less strongly with false object shapes, hadn't learned to reliably discount this specific visual signature.
2. Sun glare reflection off wet road surfaces — 19% of flagged cases.
Low-angle sun combined with a wet or recently-rained-on road surface produced a specular reflection pattern that, in a meaningful fraction of flagged frames, triggered false-positive detections resembling an oncoming vehicle's headlight signature — particularly during dawn and dusk driving windows when both low sun angle and residual road moisture were both more common. This category showed a strong time-of-day and seasonal skew: over 70% of instances occurred within two hours of sunrise or sunset, and the vast majority occurred in the three months of our dataset with the highest recorded rainfall.
3. Partially occluded traffic signs (stickers, posters, wear) — 17% of flagged cases.
Real-world traffic signs are messier than a clean training dataset tends to assume — parking tickets stuck to a sign post overlapping the sign face, promotional stickers partially covering a speed limit sign, or simply significant paint wear and fading on older signage. Our classifier's confidence dropped sharply on a meaningful fraction of these, and in about a quarter of this specific subcategory, the sign was misclassified outright rather than just flagged as low-confidence — a genuinely actionable finding, since our original training data had very few examples of this kind of real-world sign degradation compared to how often it actually appears in the field.
4. Multi-vehicle occlusion cascades at complex intersections — 14% of flagged cases.
At intersections with more than three converging lanes of traffic, sequences where one vehicle briefly, partially occluded another — for less than half a second, often — produced tracking confidence drops and occasional brief identity-switch errors (where the tracker's internal ID for a vehicle changed mid-track, incorrectly implying a different vehicle had appeared). This category was heavily concentrated in exactly the small number of unusually complex intersection geometries in our route set, rather than being evenly distributed across all urban driving — suggesting the issue is specifically about intersection complexity rather than urban driving generally.
5. Reflective cargo on trailers/trucks producing spurious radar returns — 11% of flagged cases.
The smallest of our top five by volume but arguably the most operationally interesting: large reflective or metallic cargo visible on flatbed trucks and trailers occasionally produced radar returns with range and velocity signatures inconsistent with the vehicle's actual body, effectively creating a secondary "ghost" detection near a real, correctly-tracked vehicle. Camera data correctly showed only one vehicle; radar, in these specific cases, reported what looked statistically like two co-located objects with slightly different velocity readings. This is a narrower, more specialized case than the first four, but notable because it's a failure mode inherent to the sensing modality itself (radar's sensitivity to strongly reflective surfaces) rather than a training data coverage gap in the traditional sense.
What We Did With This
Every one of these five categories fed directly back into our training data pipeline, but not in the same way — the fix differed meaningfully by category, which is itself worth noting rather than treating "add more data" as a universal answer.
For tree shadows and sun glare (categories 1 and 2, together over 40% of all flagged cases), we specifically expanded our training set with additional labeled examples drawn directly from the flagged footage itself — genuinely the highest-value new training data we could add, since it came from exactly the conditions our model was already demonstrably struggling with, rather than more generic footage that happened to look similar.
For partially occluded signs (category 3), the fix was only partly a data problem — we also adjusted our labeling guidelines to explicitly require annotators to label degraded/occluded signs with an explicit "partially occluded" attribute rather than either skipping them or labeling them identically to clean signs, which gives the model an explicit signal to learn the distinction rather than implicitly averaging degraded and clean signs into one blurred category.
For intersection occlusion cascades (category 4), since the issue concentrated in a small number of specific intersection geometries, we prioritized targeted additional data collection at those exact locations rather than broad additional urban driving — a more efficient use of collection effort than assuming the problem required proportionally more data across all urban routes.
For radar ghosting from reflective cargo (category 5), this one didn't get fixed primarily through more training data at all — it's better addressed through a sensor-fusion-level rule that down-weights radar-only detections lacking camera corroboration under specific signature conditions, since the underlying issue is a sensing physics limitation rather than something a perception model can be trained to fully overcome on its own.

The Broader Takeaway
The single biggest lesson from this exercise wasn't any specific edge case — it was how unevenly distributed the value of additional data collection actually is once you can see where a model is genuinely struggling. Before this analysis, our instinct, like most teams', was "collect more diverse driving data broadly." After it, the actual highest-leverage next steps were narrow and specific: more dawn/dusk wet-road driving, more degraded-signage examples, more data from four particular intersections, and one sensor-fusion rule change that has nothing to do with data volume at all. Uncertainty- and disagreement-based mining across the fleet's full logged hours is what made that specificity possible — without it, we'd still be collecting broadly, evenly, and far less efficiently than the data we already had was capable of telling us to.